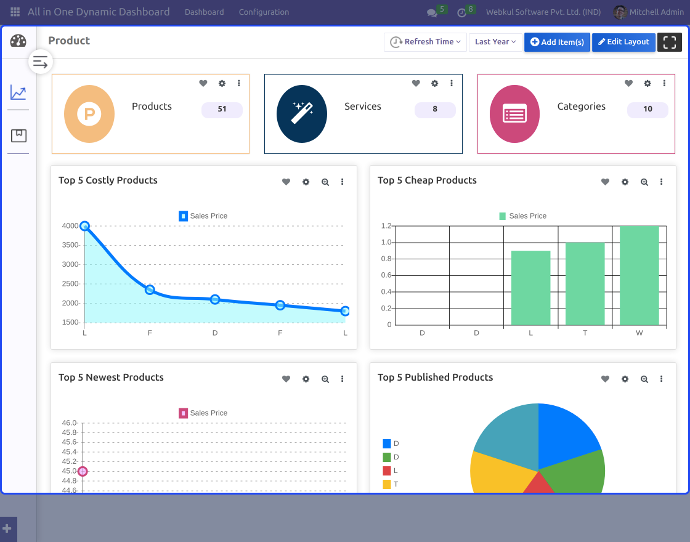
Odoo All in One Dynamic Dashboard: Create your own custom Odoo Dashboard for business Analytics using Neat Graphs and Data Plots. Design graphs for various Odoo models such as sales orders, products, purchase orders, etc. The data is directly fetched from the records in Odoo and plotted in the selected graph according to the chosen parameters. Study your store and website Data with graphs. And export the data to pdf with a click. The module supports multiple types of inbuilt graphs and multi-company compatibility.
Screenshots


Odoo All in One Dynamic Dashboard Features
Install A Perfect Analytical Tool For Odoo
- Include Analytical Data of your business in Odoo under one screen.
- Use Plots and Graphs to study the Store Data.
- Auto- Fetch the required data and plot it on the graph.
- Analyze and Strategize the data to implement proper growth steps.
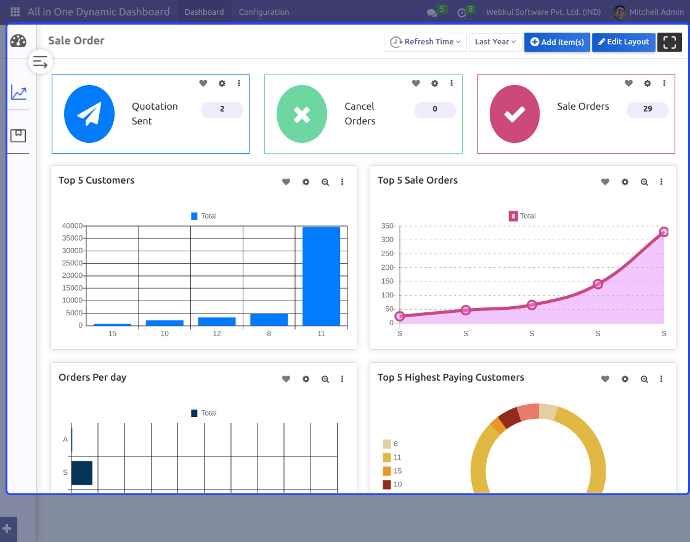
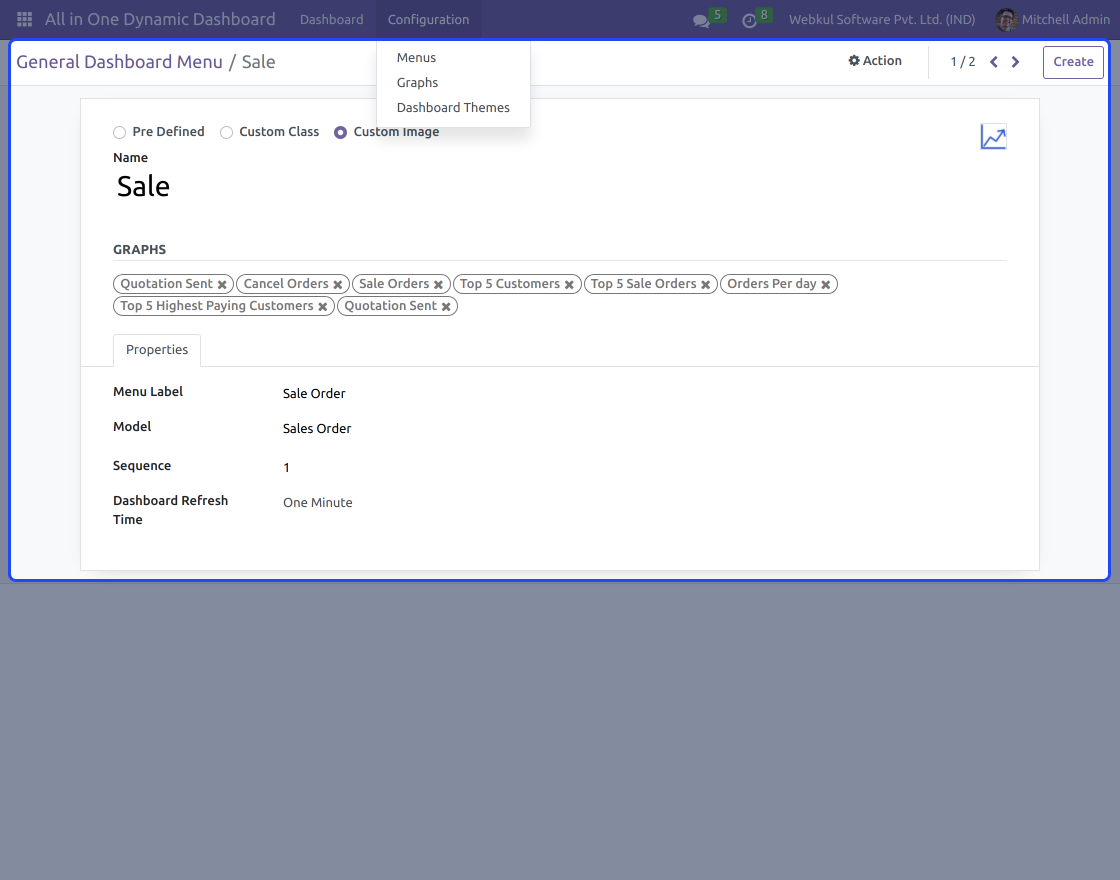
Create Dynamic Dashboards For Odoo Models
- The Dynamic Dashboards change with change in data.
- Create multiple Dashboards for different Odoo modules such as Sales, Purchase, etc.
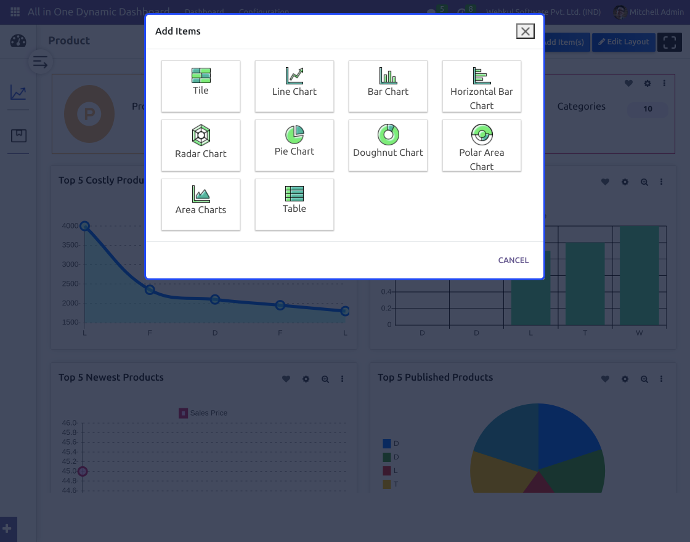
Choose Between Different Types Of Graphs
- Choose From a number of different graphs and charts.
- Pie Chart, Line Chart, Doughnut Chart.
- Histograms - Vertical and Horizontal.
- Radar Chart, Area Chart, and KPI Chart.
- It also includes tiles and cards for Quick View.
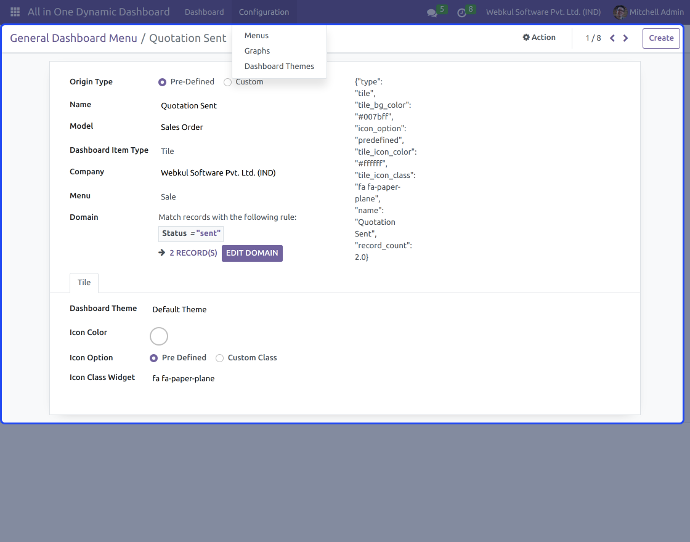
Plot Desired Graph In Seconds
- Use the Predefined options to create any desired plot/graph in seconds.
- Or create a custom graph using the Create Graph Menu.
- Create your graphs from scratch.
- Choose the data to fill, limit the number of records, etc.
Quick Edit Mode On Dashboard
- Quickly edit and arrange the graphs directly from the Odoo Dashboard.
- Set the number of records to be used in the graphs and charts while plotting.
Set Dashboard Refresh Interval
- Make sure the data is always updated as frequently as possible.
- Fetch the data automatically with the refresh interval setting.
- Choose the Data Refresh Interval to reflect new data on graphs as required.
- Set Refresh Rate between one minute to Fifteen minutes.
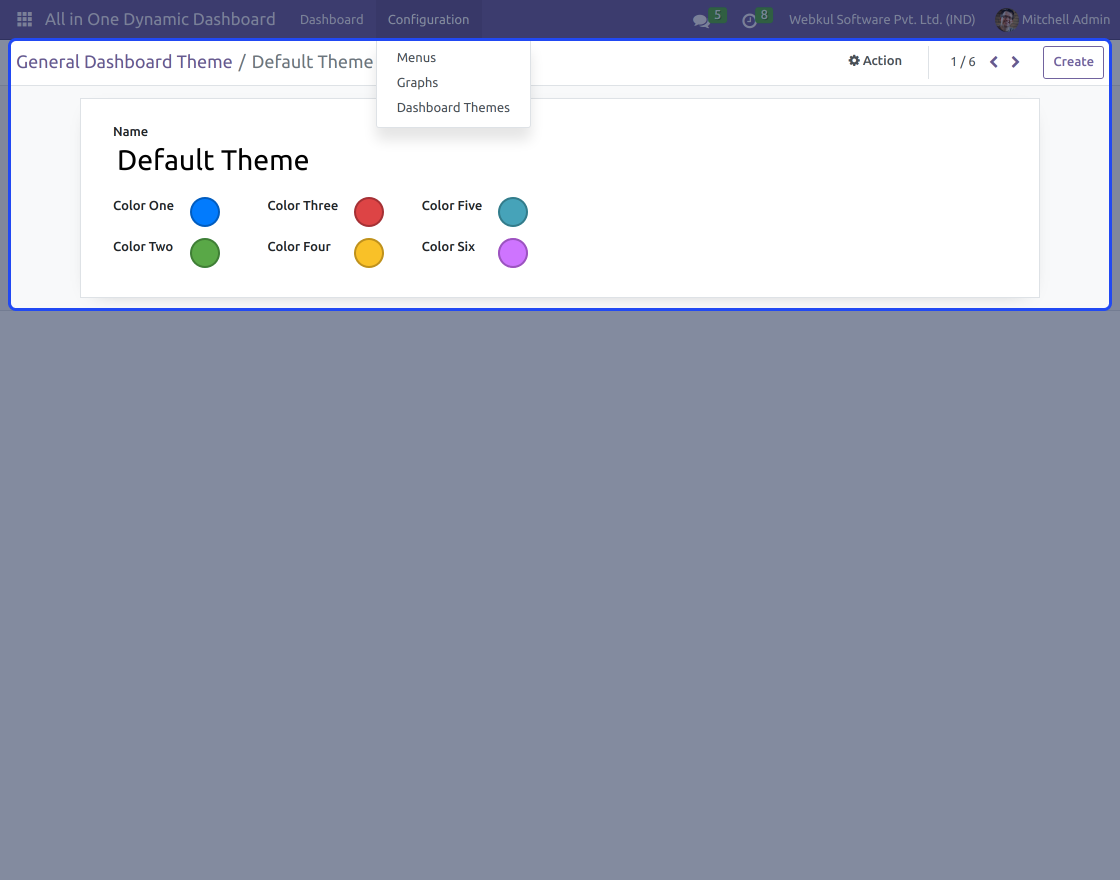
Customize Dynamic Dashboard Theme & Widgets
- Configure the Dashboard Color Theme to represent Data.
- Use the color palette to distinguish different graph data.
- Create and save multiple color themes for different Dashboards.
- Fa-fa icon support for data cards and graphs.
Define Access Permissions For Odoo Users
- Set different Access levels of Odoo dashboard for users.
- Choose between User and manager Access.
- Manager- Complete Edit Rights of Odoo Dashboard.
- User - only View rights and limited edit rights.
Use Custom Filters To Sort Data
- Use Custom filters to sort out and study the Odoo Dashboard.
- Provided - time and date filters to improve visibility.
Multi-Company Supported
- Built for people who manage multiple companies in the same Odoo.
- Use separate Odoo Dashboard For different companies in Odoo.
- Manage And Study the Dashboard Data for each individually.
- Compare data instantly from various of your companies in Odoo.
Mobile Responsive Design
- The module is designed to be mobile responsive.
Export Data To Pdf
- Export Data Of each Graph to PDf with a Click.
Via Webkul